Connect Azure instance
Caution
Microsoft Azure functionality is currently in technical preview and is subject to change.
Activate Microsoft Azure
The Microsoft Azure feature is turned off by default. To turn it on:
-
Go to Configuration → Settings → Advanced Settings.
-
Click the toggle in the Technical preview features section of the page.
Required settings
It is possible to use PMM for monitoring Azure database instances like other remote instances. In this case, the PMM Client is not installed on the host where the database server is deployed. By using the PMM web interface, you connect to the Azure DB instance. Discovery is not yet implemented in PMM but it is possible to add known instances by providing the connection parameters.
First of all, ensure that there is the minimal latency between PMM Server and the Azure instance.
Second, add a firewall rule to enable access from PMM Client like this:
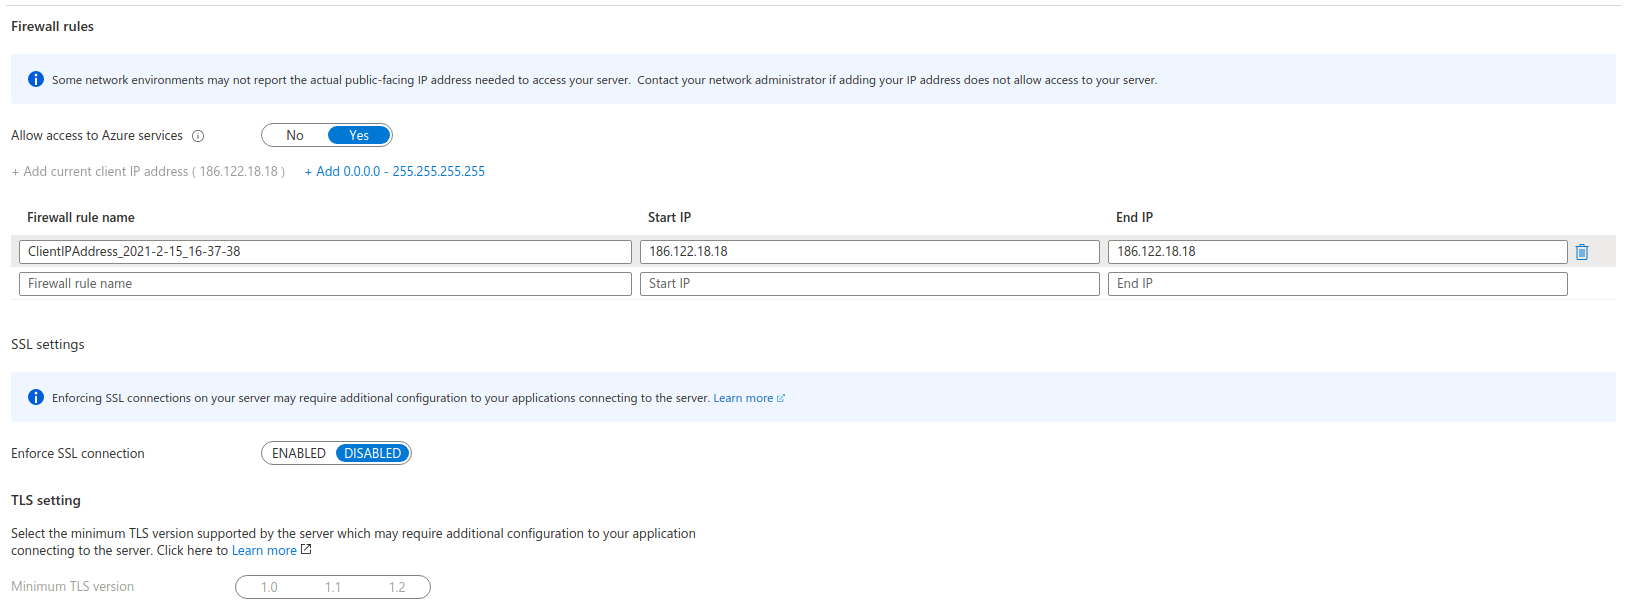
Setting up a MySQL instance
Query Analytics requires you to configure Performance Schema as the query source, because the slow query log is stored on the Azure side, and QAN agent is not able to read it. Enable the performance_schema option under Parameter Groups in Azure MySQL databases.
When adding a monitoring instance for Azure, specify a unique name to distinguish it from the local MySQL instance. If you do not specify a name, it will use the client’s host name.
Create the pmm user with the following privileges on the Azure MySQL database instance that you want to monitor:
CREATE USER 'pmm'@'%' IDENTIFIED BY 'pass';
GRANT SELECT, PROCESS, REPLICATION CLIENT ON *.* TO 'pmm'@'%';
ALTER USER 'pmm'@'%' WITH MAX_USER_CONNECTIONS 10;
Adding an Azure Instance
Follow the instructions for remotes instances explained here, Azure MySQL databases are similar to AWS RDS databases.
Example:
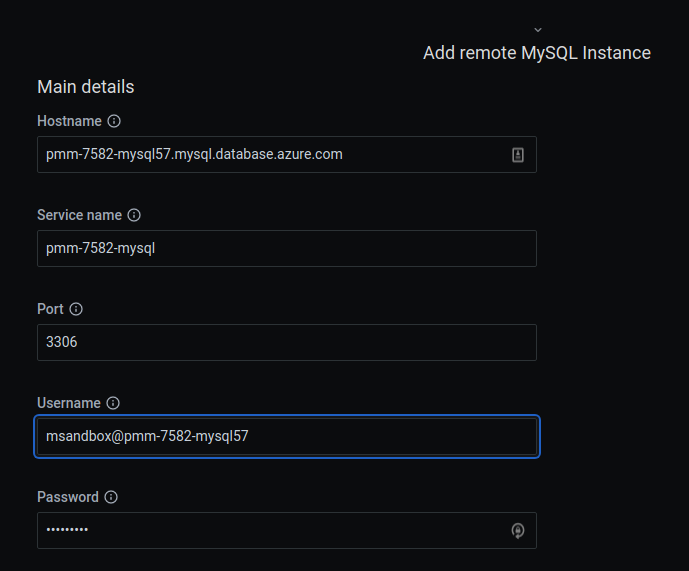
and be sure to set Performance Schema as the query collection method for Query Analytics.

MariaDB
MariaDB up to version 10.2 works out of the box but starting with MariaDB 10.3 instrumentation is disabled by default and cannot be enabled since there is no SUPER role in Azure-MariaDB. So, it is not possible to run the required queries to enable instrumentation. Monitoring will work but Query Analytics won’t receive any query data.
PostgreSQL
For PostgreSQL follow the same methods used for MySQL and MariaDB and enable track_io_timing in the instance configuration to enable Query Analytics.
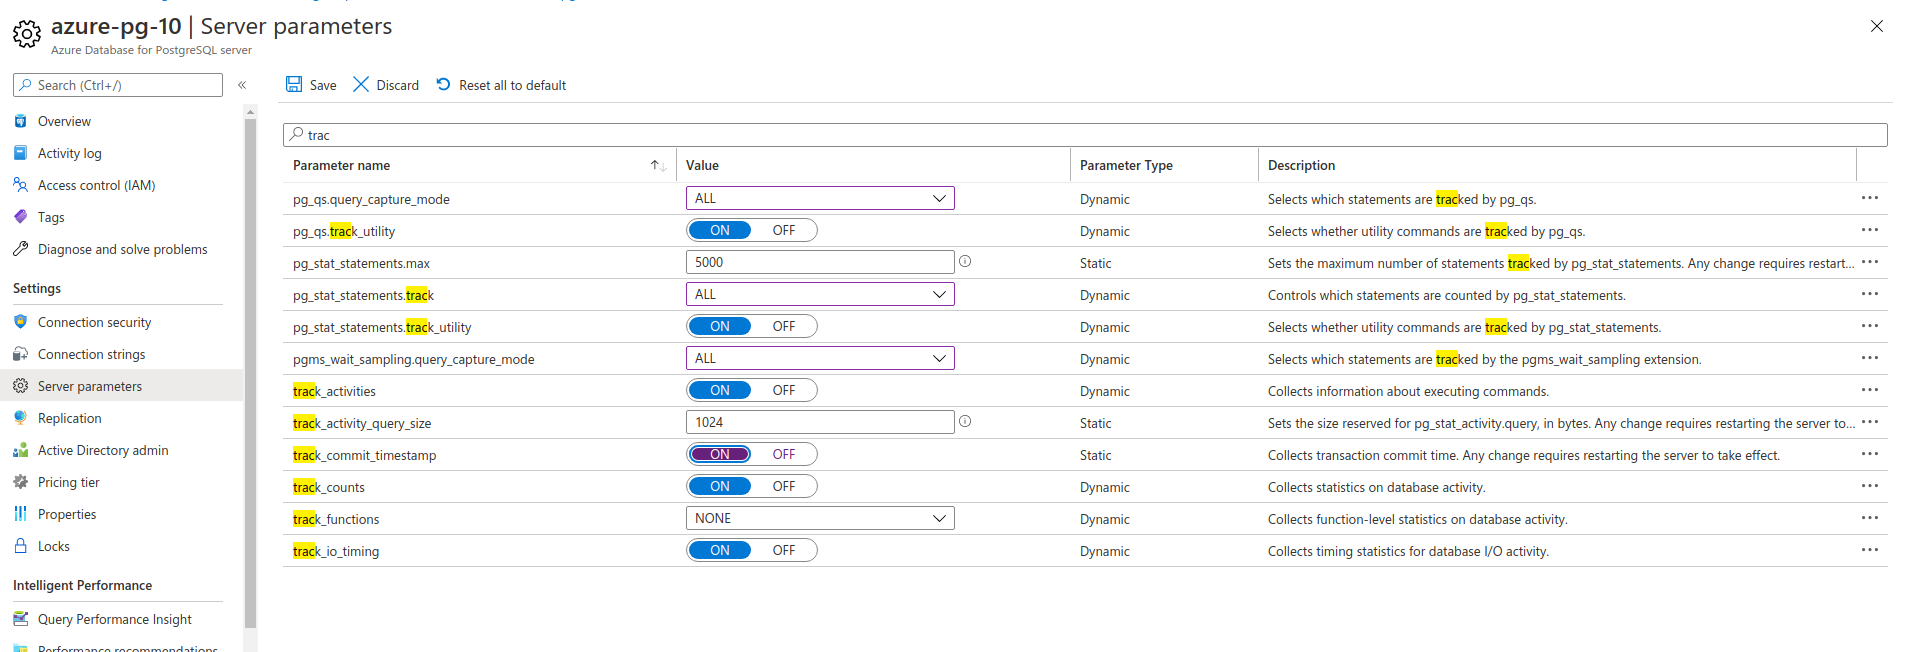
For Query Analytics, set the server parameter:
pg_stat_statements.track = all
To discover databases on Azure
You need to get the Client ID, Client Secret, Tenant ID and Subscription ID.
Get the subscription ID
To get a subscription ID:
-
Search Subscriptions, click on your subscription name

-
Copy the subscription ID

Create a new application to get the tenant ID, client ID and the client secret
To get the tenant ID, client ID and the client secret:
-
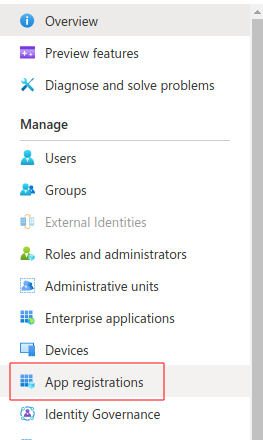
Search for Azure Active Directory
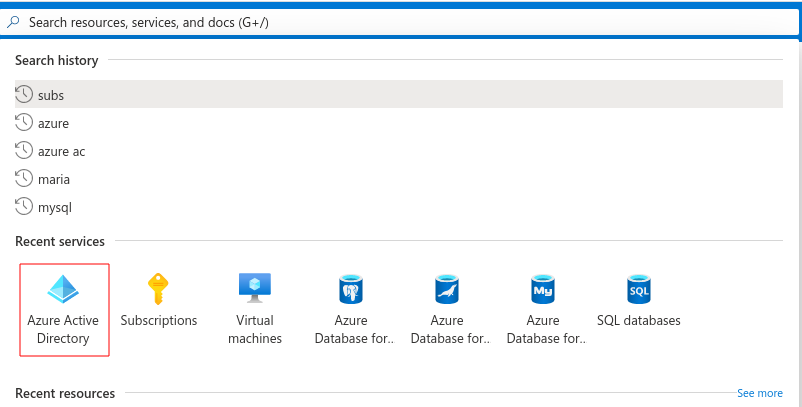
-
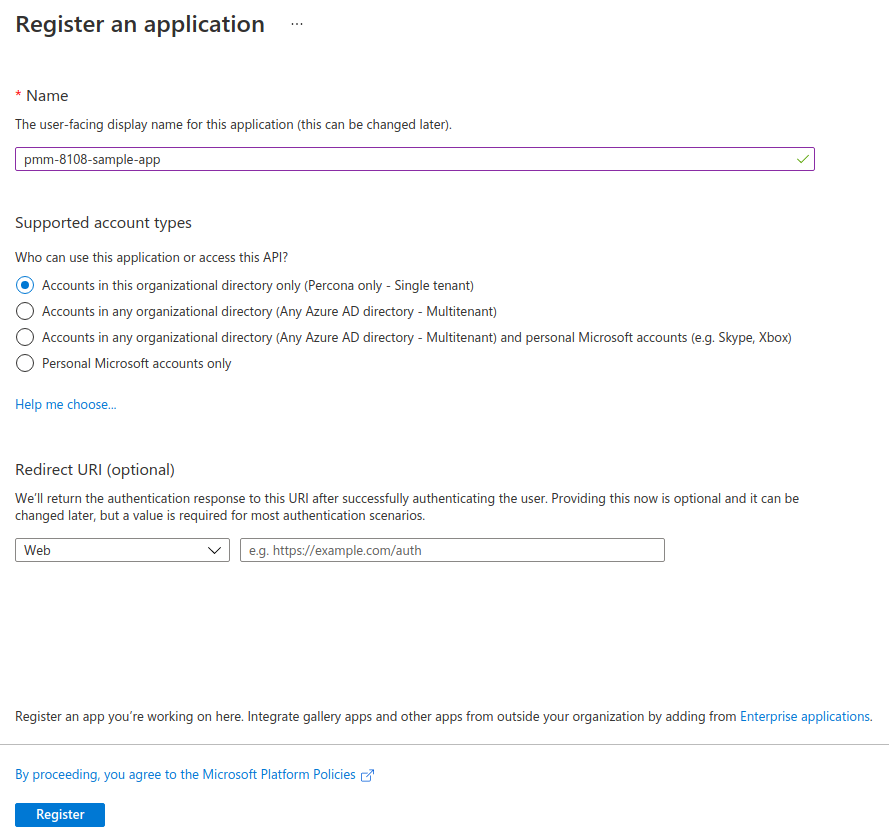
Register a new application

-
At this point you can copy the client and tenant IDs.

-
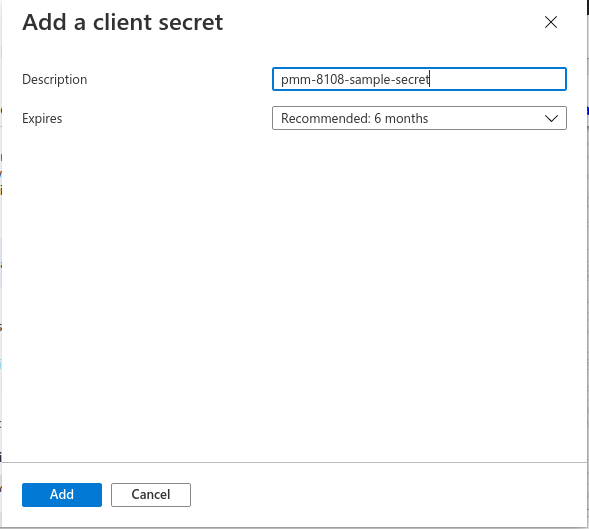
Create an application secret.


-
Copy the value of the application secret. Once you leave this page you won’t be able to see the secret again and you will have to generate a new one.

-
Give API access permissions to your application.
-
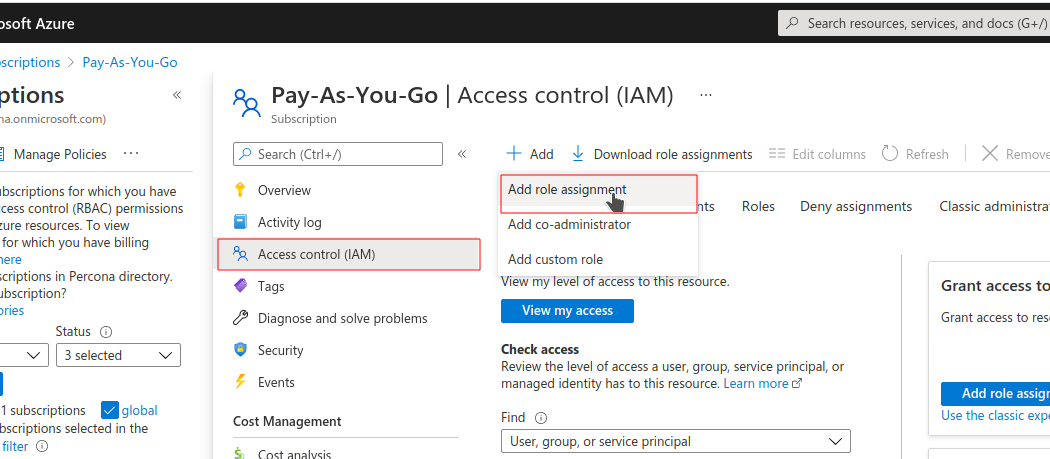
Search for Subscriptions like in step 1.
-
Select your application and grant Monitor Reader permissions. This might require you to have admin permissions in your Azure account.
-
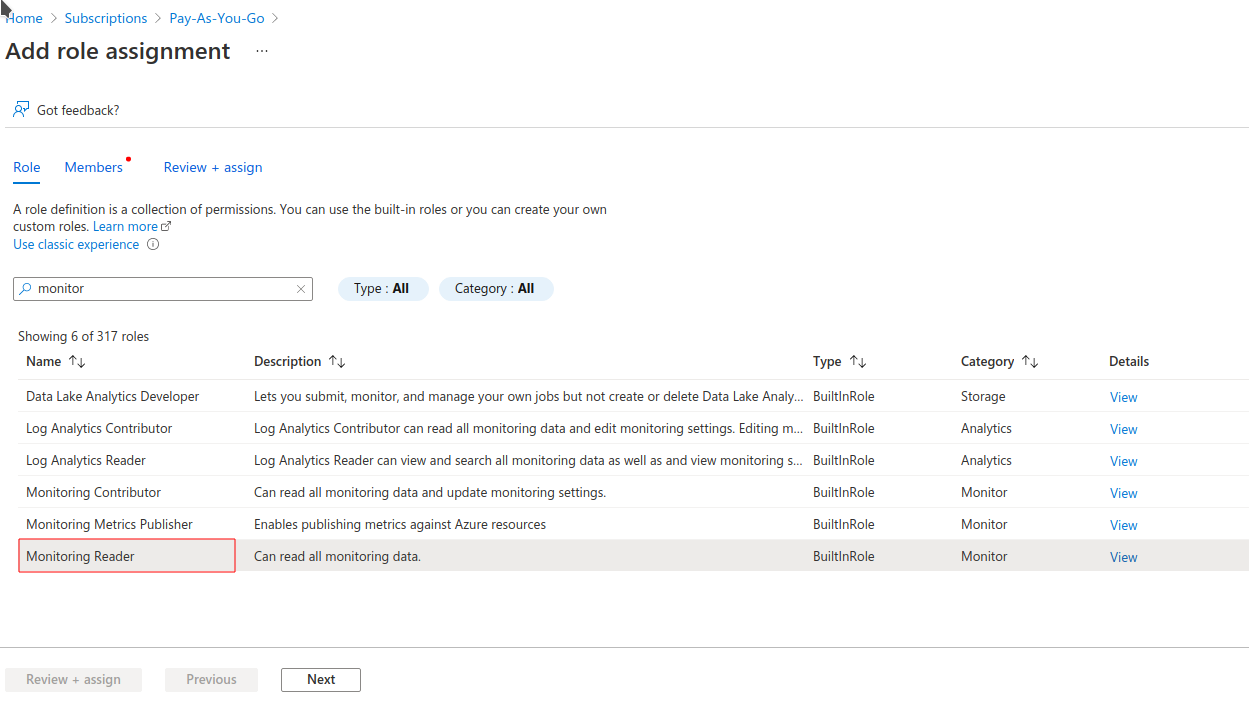
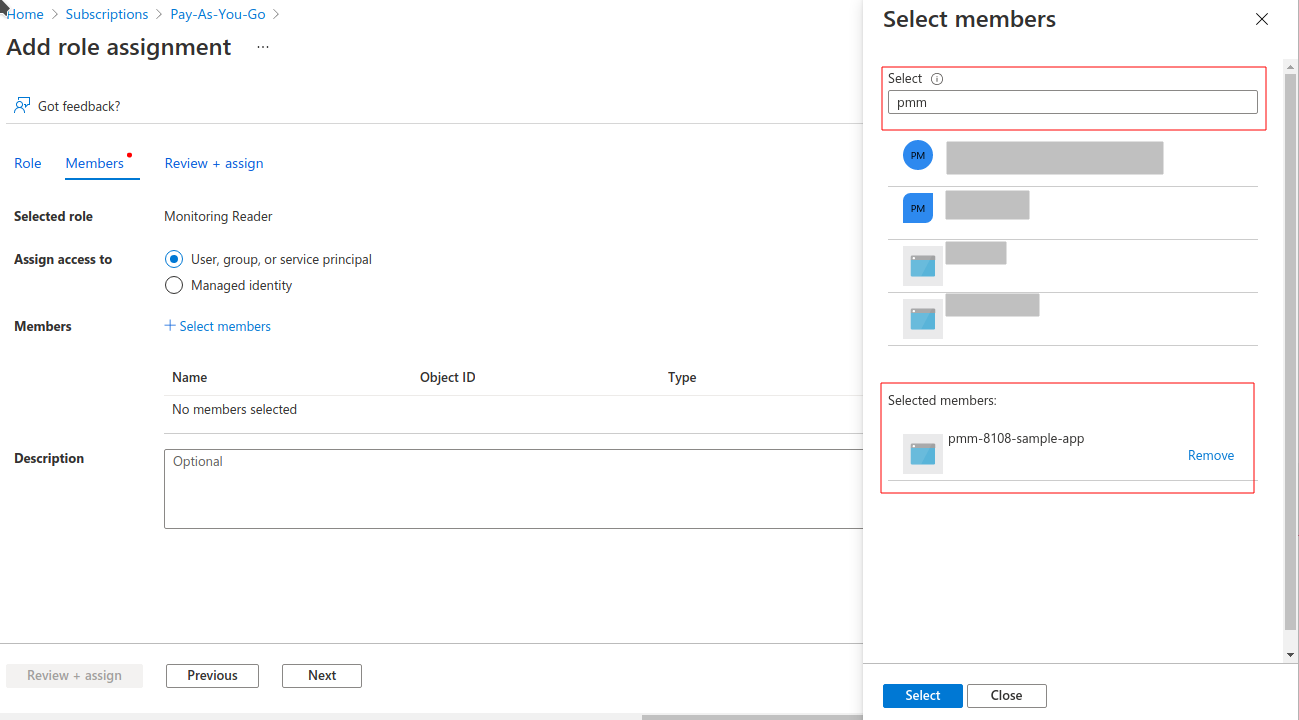
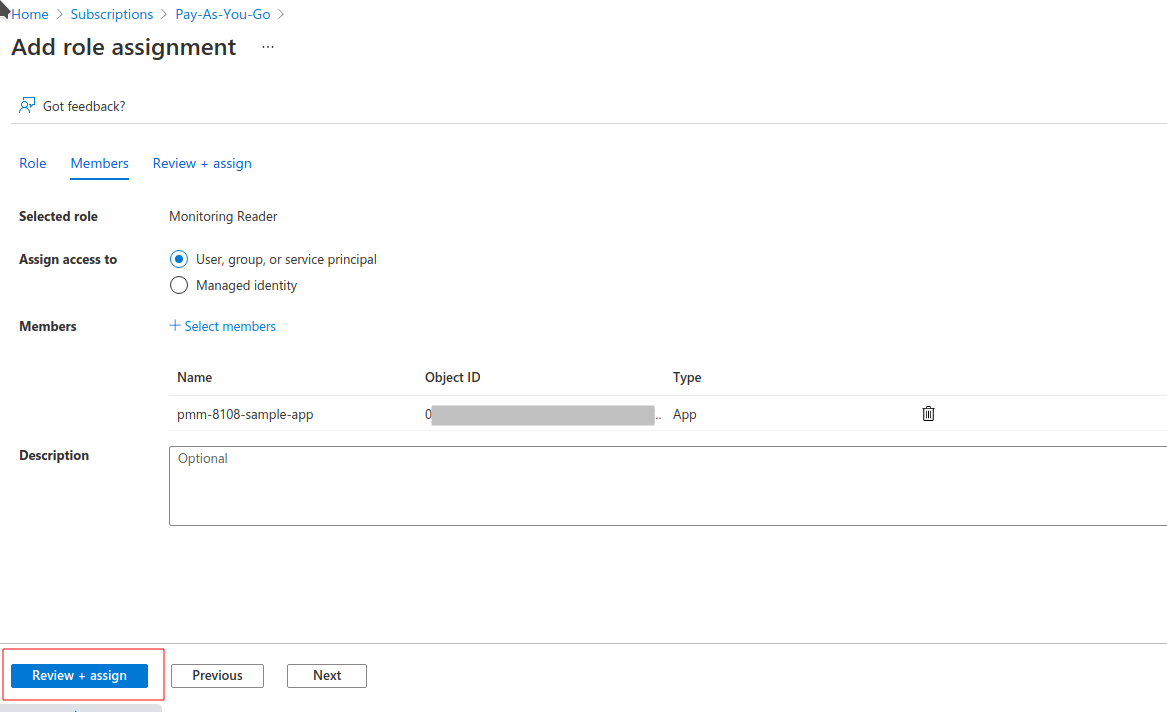
When you fill in all fields press the Discover button and you will see a list of available databases for monitoring.
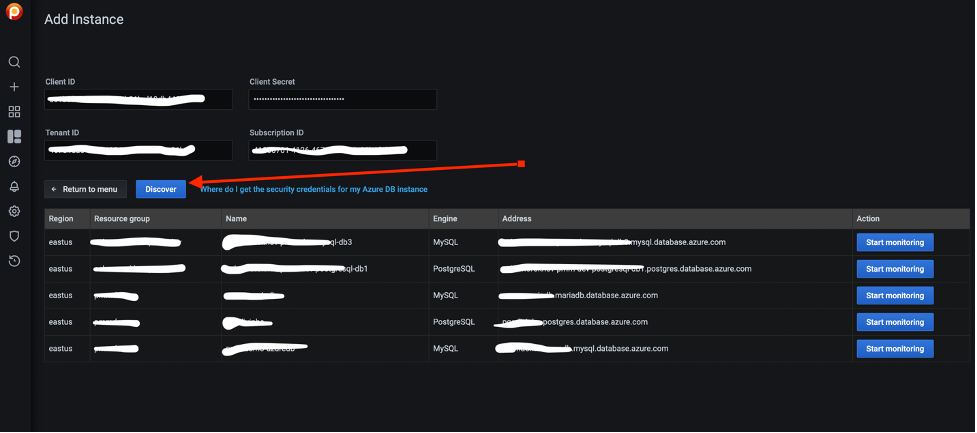
You can monitor 6 types of databases:
Microsoft.DBforMySQL/serversMicrosoft.DBforMySQL/flexibleServersMicrosoft.DBforMariaDB/serversMicrosoft.DBforPostgreSQL/serversMicrosoft.DBforPostgreSQL/flexibleServersMicrosoft.DBforPostgreSQL/serversv2
You can find more details on how to create DB on Azure at:
Tip
You must set pg_stat_statements.track = all in your PostgreSQL Server settings to use PMM Query Analytics. (Read more.)

In the list of databases on the Discovery page click Start Monitoring to add the selected Azure Database to PMM.
Fill in all required fields and click Add service.
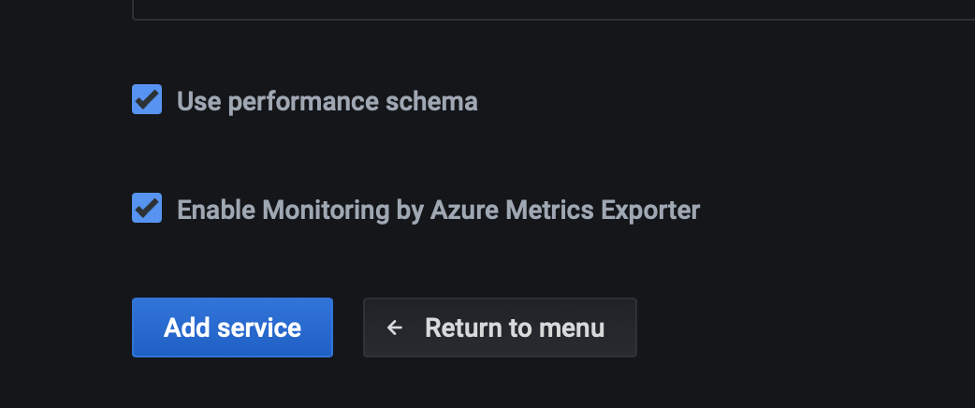
PMM can use 3 exporters to collect metrics:
-
Azure Metrics Exporter – collect “system” metrics related to DB.
node_cpu_averageazure_resource_infonode_filesystem_size_bytesazure_memory_percent_averageazure_storage_percent_averageazure_storage_used_bytes_averagenode_network_receive_bytes_totalnode_network_transmit_bytes_total
-
mysql_exporterorpostgres_exporter– to collect database related metrics. -
PMM Agent to collect queries related metrics using
pg_stat_statementsfor PostgreSQL or Performance Schema for MySQL (MariaDB)
Adding an Azure Instance on pmm-client side
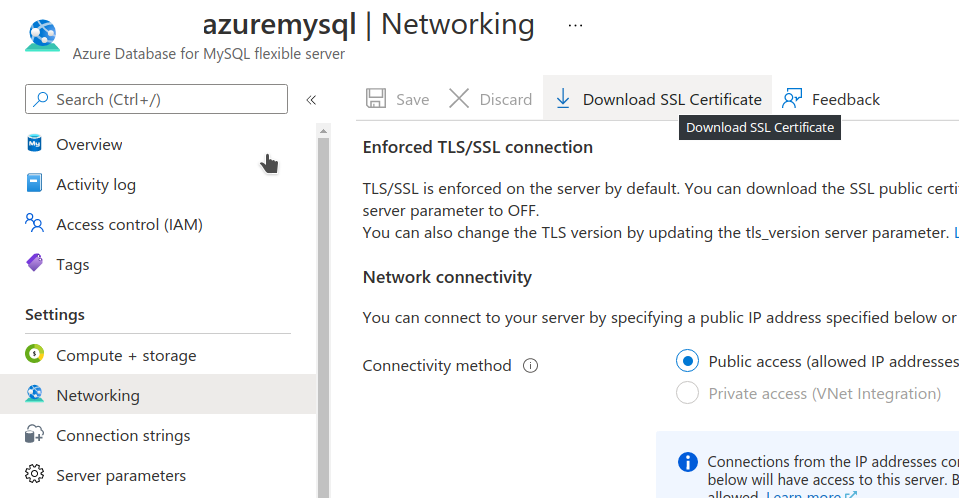
TLS/SSL is enforced on the server by default. So please download the certificate needed to communicate over SSL with your Azure Database. It can be done on Networking tab for your Azure Database instance.
Also enforced TLS/SSL connection option can be disabled on server side.
Command for adding an azure database service for monitoring without TLS/SSL.
pmm-admin add mysql --username=azureuser --password=secure --host=azuremysql.mysql.database.azure.com --service-name=azure1 --query-source=perfschema
Downloaded certificate is named DigiCertGlobalRootCA.crt.pem.
An example of the command for adding an Azure database service for monitoring with TLS/SSL would be:
pmm-admin add mysql --username=azureuser --password=secure --host=azuremysql.mysql.database.azure.com --service-name=azure1 --query-source=perfschema --tls --tls-ca=DigiCertGlobalRootCA.crt.pem --tls-cert=client-cert.pem --tls-key=client-key.pem --tls-skip-verify
Get expert help
If you need assistance, you can find comprehensive and free database knowledge on our community forum or blog posts. For professional support and services, contact our Percona Database Experts.