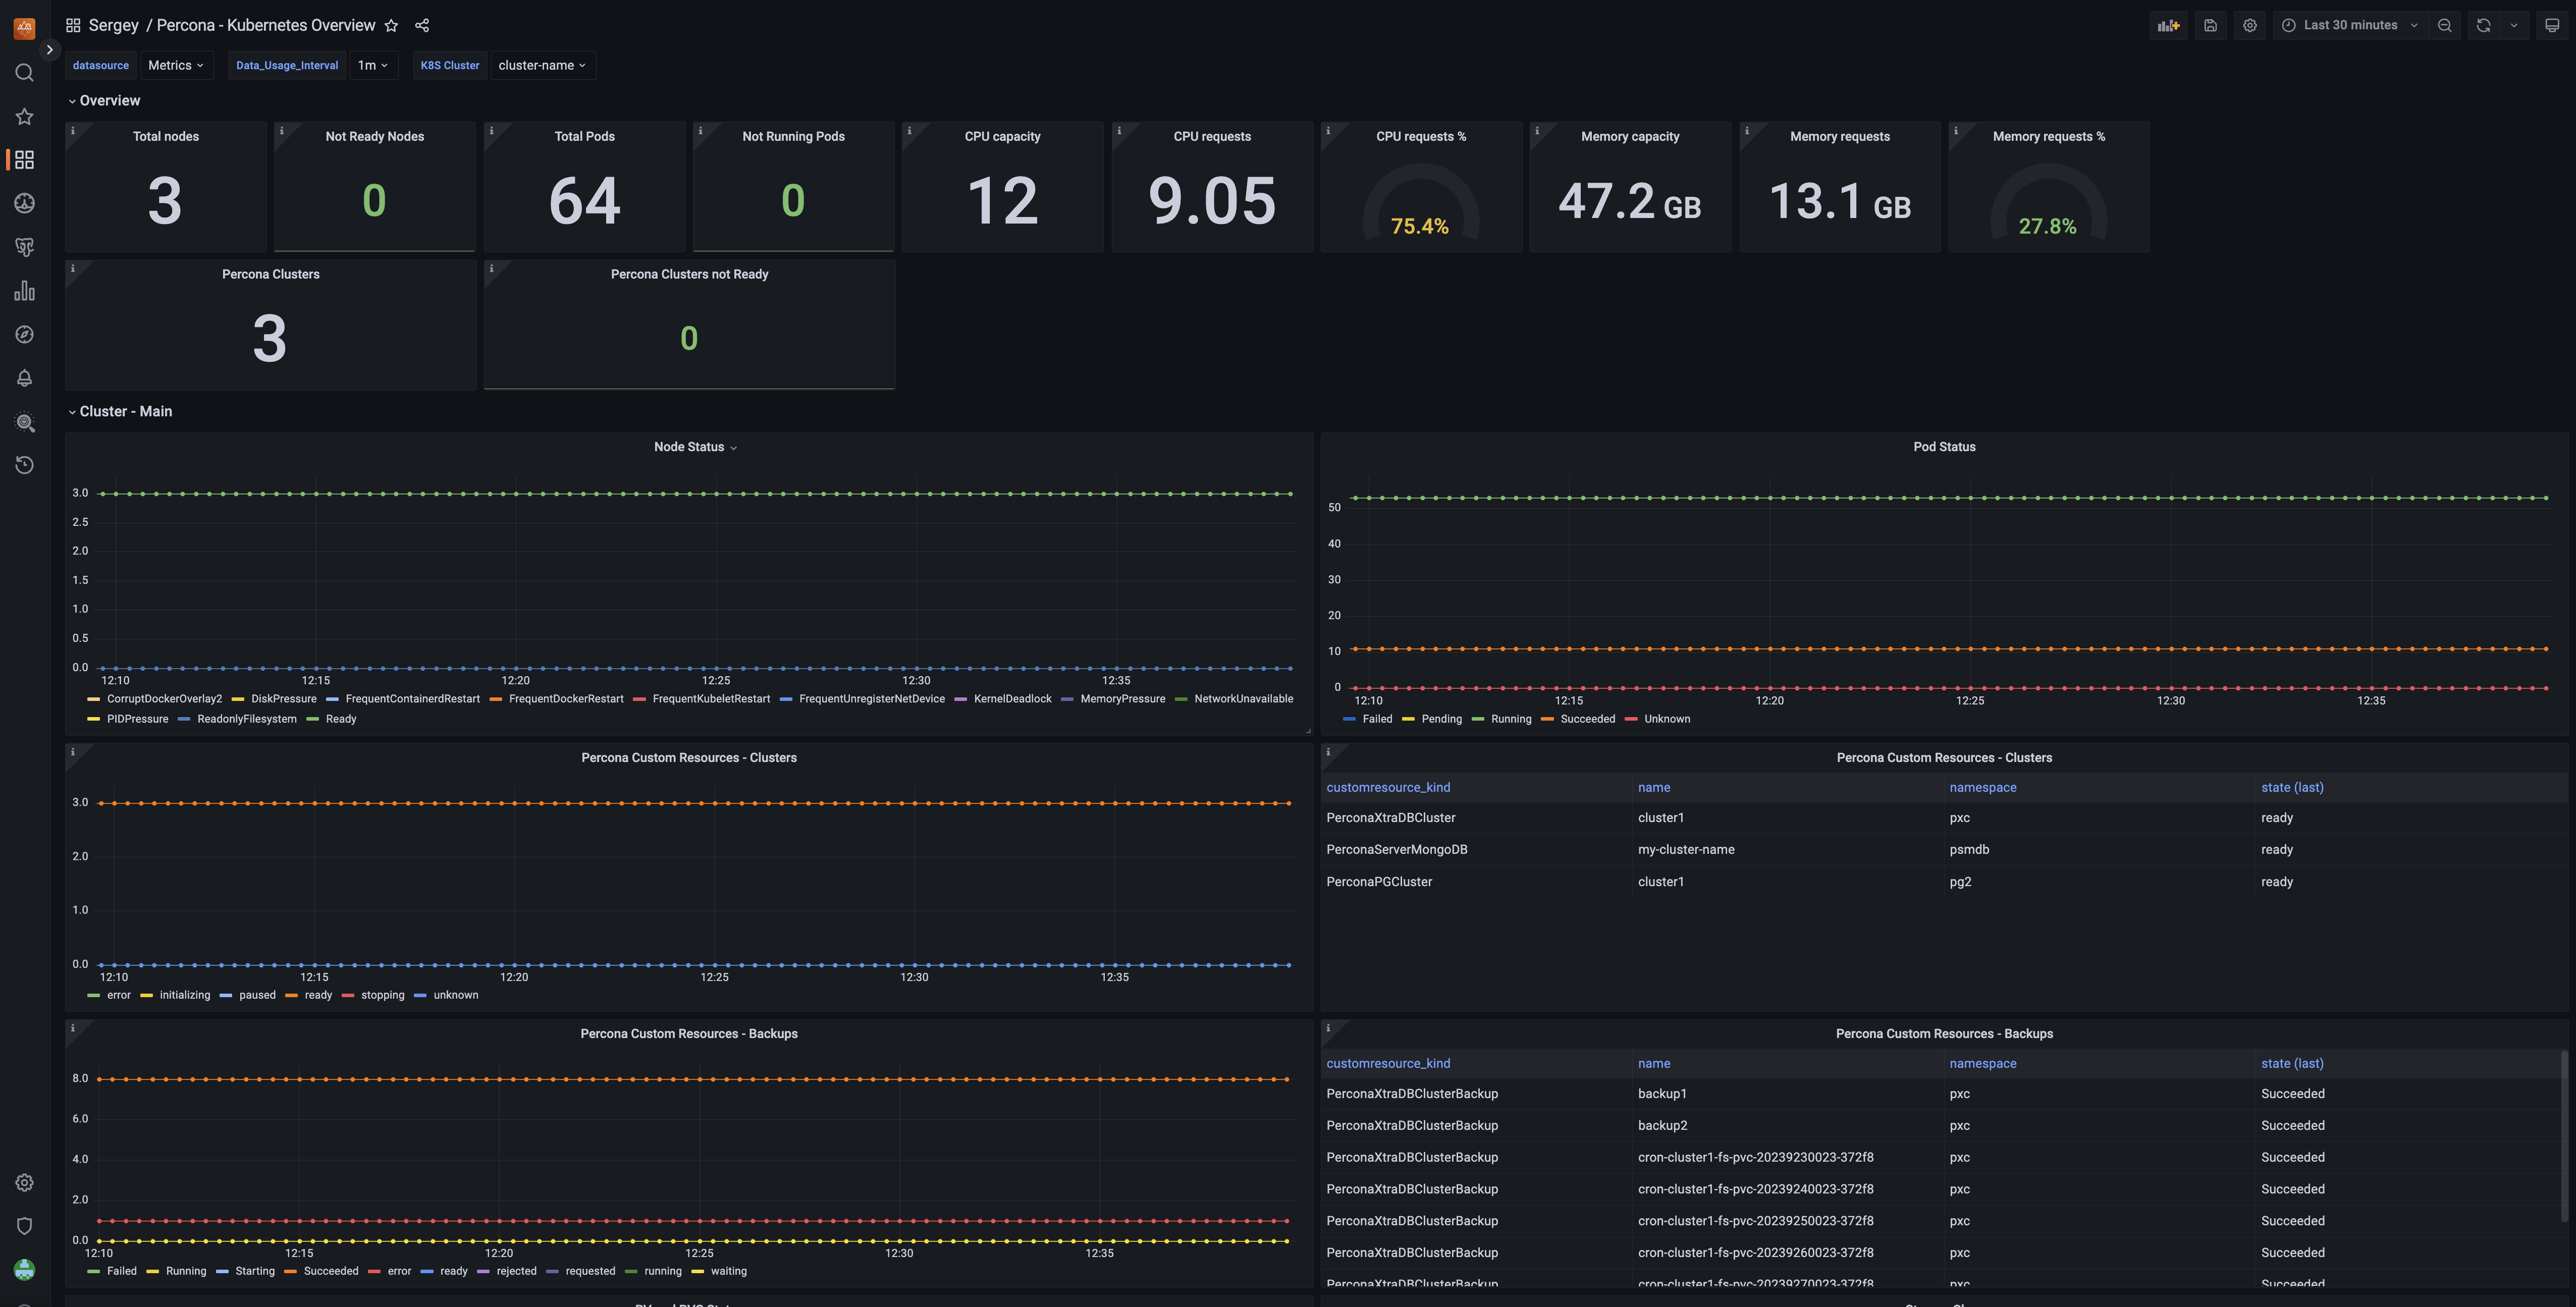
Kubernetes monitoring for Percona Operators
Important
This feature is still in Technical Preview and is subject to change. We recommend that early adopters use this feature for testing purposes only.
Monitoring the state of the database is crucial to timely identify and react to performance issues. Percona Monitoring and Management (PMM) solution enables you to do just that.
However, the database state also depends on the state of the Kubernetes cluster itself. Hence it’s important to have metrics that can depict the state of the Kubernetes cluster.
For information on setting up monitoring for the Kubernetes cluster health, see documentation.
This setup has been tested with the PMM server as the centralized data storage and the Victoria Metrics Kubernetes monitoring stack as the metrics collector. These steps may also apply if you use another Prometheus-compatible storage.
Kubernetes overview
The Kubernetes Cluster overview dashboard gives you an overview of Kubernetes health and its objects, including Percona custom resources.

Get expert help
If you need assistance, you can find comprehensive and free database knowledge on our community forum or blog posts. For professional support and services, contact our Percona Database Experts.